Coorong Dryland Salinity Review
Coorong Dryland Salinity Review
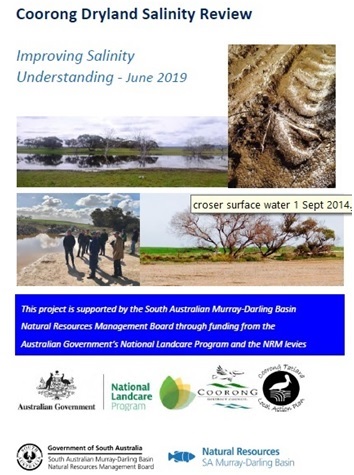
Meningie East Version - Coorong Dryland Salinity Review
1. Coorong Dryland Salinity Background
The Coorong Dryland Salinity Review;
- Brings together resources to provide an overview of the current level of dryland salinity in the Coorong District,
- Provides discussion of the potential causes of the dryland salinity,
- Identifies actions, and where further resourcing is required to better understand the causes and potential solutions.
1. Coorong Dryland Salinity Background
1a. Coorong Dryland Salinity Report Summary
1b. Summary & Key Recommendations
2. Salinity Risk Mapping
Please click here to access Coorong District Salinity Risk Mapping
3. Coorong Dryland Salinity Survey
A Coorong Dryland Salinity Survey was conducted in late 2018 via direct land owner contact.
To access this information please click on the link below.
Coorong Dryland Salinity Survey 2018 and 2020
4. Coorong Dryland Salinity Description and Impacts
A large amount of salt is stored in the subsurface soils underlying parts of the Coorong. Historically this salt was accumulated when the area was originally covered with seawater. In the Mallee highland zone the salt is held at depth while on the Coastal plains it is much closer to the surface.
A dryland salinity problem emerges when a rising watertable mobilises salts and carries them upwards close to the ground surface where they are further concentrated by evaporation.
For further detail of the description of dryland salinity in the Coorong District and the impacts, click here.
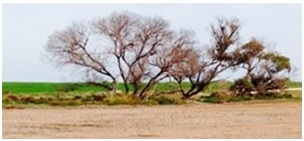
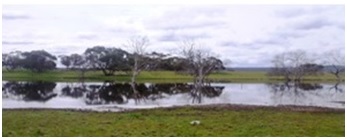
Above: Dryland Salinity affected native vegetation
5. Local Watertables Explained
There are two groundwater flow systems occurring in the Upper SE; a local unconfined aquifer and a deeper regional confined aquifer. The shallow unconfined system lies on top of the confining clay layer which separates it from the underlying confined aquifer. The whole area can be likened to a big ‘bucket’ that has now filled up to capacity beneath the low-lying Coastal Plain. Please click on the link below to access further information on our local watertables.
Coorong Local Watertables Explained.

Above: Unconfined aquifer flow system
Please click here to access Unconfined and Confined Aquifer Maps
6. Coorong Hydrogeological Systems
There are two distinct groundwater flow systems: a shallower unconfined sandy limestone aquifer and a deeper confined limestone aquifer. They are separated by a layer of confining clay which does not transmit water between the two systems.
For more information about;
- the shallow unconfined watertable aquifer, and
- the deep regional confined aquifer.
Please click on this link to access further information on our Coorong Hydrogeological Systems.
Please click here Unconfined and Confined Aquifer Maps
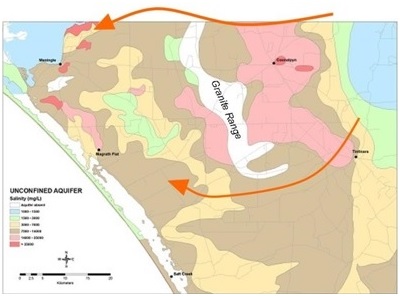
Above: Unconfined aquifer movement around the Padthaway Ridge
7. Rainfall Trend Graphs and Rainfall Deciles
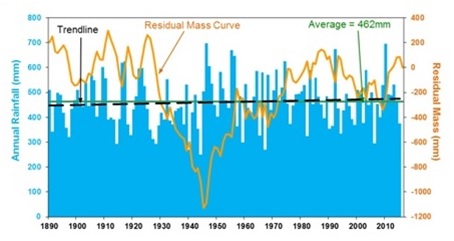
Rainfall trend analysis is calculated using the cumulative variation / deviation from the mean rainfall (also called a residual rainfall or residual mass curve). In periods where mostly above average rainfall occurs, graphs show a positive or increasing variation from the mean. A falling curve represents periods receiving below average rainfall. Click here for more information about Rainfall Trend Graphs and Rainfall Deciles
8. Watertable Trends and Graphs
Water level data is available on the Department of Environment and Water (DEW) website. The address is www.waterconnect.sa.gov.au. The Obswell tab on the Groundwater Data page can be used to find records for each water well.
Each site has an Obswell Number based on the Hundred in which the bore is located (e.g. SHK003) and may have a field number that was used to identify the site when the bore was being drilled.
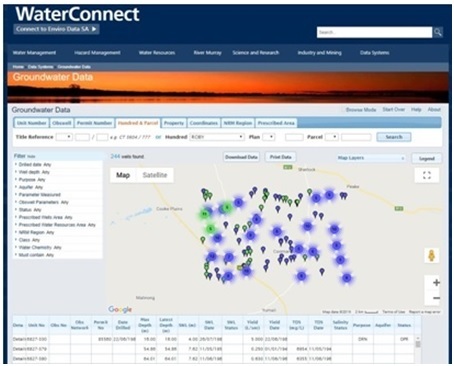
Above: Screen shot of the Water Connect Groundwater Data pages
The patterns of groundwater trends can be related to landscape, topography, and elevation. Rising watertables are often associated with higher elevation land while fluctuating watertables (seasonal highs and lows) can be correlated with rainfall on flat lower lying land.
Watertable trends fall into the following categories:
- Continuously rising trend
- Episodic rise (rises and falls, but each rise is higher than the previous one)
- Seasonal trend (strong seasonal peaks and troughs which correlates with winter rainfall and summer evaporative discharge)
- Static / stable (has rises and falls but no overall change in the longer term)
- Falling trend
Coorong Watertable Trends and Graphs click here. For further detail in regard to the following locations click on the following links.
8a. Groundwater and Rainfall Trends - Coomandook Cooke Plains Site Locations & Hydrographs
8b Groundwater and Rainfall Trends - Meningie East Site Locations & Hydrographs
8c Groundwater and Rainfall Trends - Tintinara West Site Locations & Hydrographs
8d Groundwater and Rainfall Trends - Coomandook Landcare Network locations and measurements
8e. Appendix Coomandook Landcare Piezometer Network Repairs and Updgrade
9. Coorong Dryland Salinity Mythbusting
The following questions have been raised at meetings and field days and require a scientific explanation.
- Is the unconfined aquifer pressurised?
- Why isn’t there an immediate response to high rainfall events?
- Why do the best crops occur in the year before ground goes saline?
- What is the effect of raised Lower Lake levels on the watertable and dryland salinity?
- Impact of gypsum mining in the Cooke Plains area?
- Why does dryland salinity get worse in a dry year?
- Are there ‘underground rivers’ pushing down from the Mallee groundwater system?
- Where does the confined aquifer finally express itself?
- Has the pressure in the confined aquifer changed?
- Is the unconfined aquifer moving quicker than we think it is?
- If the water comes up, what is the equivalent amount of rain?
- How much evaporation do you need to equate with rainfall and inputs coming in. What size evaporation pond would this require?
- Why are the areas around Ashville not experiencing the same challenges in terms of increases in salinity?
- Additional dryland salinity maps
- Additions to the piezometer network
Click on this link to access the answers to these questions. 9. Coorong Dryland Salinity Mythbusting
Lower Lakes Coomandook
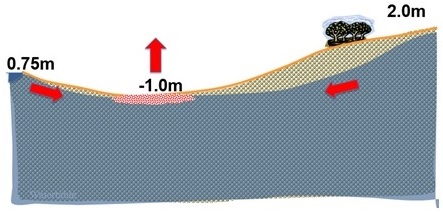
Above: Coorong District cross section
10. Land Use Change and Vegetation Cover
This data does illustrate an increase in area under continuous and mixed cropping farming systems, particularly around the northern area shown on the map. This land use does have a lower plant water use than perennial pastures. When coupled with summer weed control techniques, the level of water use on these areas would be low relative to well management dryland lucerne pastures http://www.abc.net.au/science/articles/2001/08/14/345557.htm
It is difficult to quantify what the actual change in plant water use across the landscape could be as a result of shifts in the coverage, health, and density of perennial pastures, and increases in areas land under annual cropping. Additionally this land use change data does not quantify annual vs perennial pastures, or the quality of these pastures across the areas defined as having grazing land use.
It is widely accepted and proven through past studies that healthy perennial pastures or other perennial vegetation, when paired with ground cover, provides the greatest plant water use option and hence greatest potential in recharge reduction to saline groundwater. This remains the best option we have for reducing recharge to groundwater at both the local and regional level. This expanded discussion, maps and data can be accessed by clicking here 10. Land Use Change and Vegetation Cover
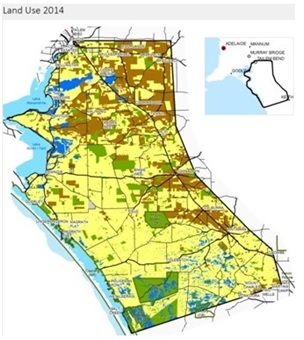
Above: Land Use Map 2014
To access the Land Use Change and Fractional Vegetation Cover Maps and supporting data please click here.
11. Dryland Salinity Management Recommendations 2019
This section discusses the accepted best land management practices over the last several decades to reduce recharge, address dryland salinity, and establish salt tolerant plants. All of these practices are still very relevant.
The management of dryland salinity can be divided into two sections
1) Attacking the cause
2) Treating the effects
To access this section please click here Dryland Salinity Management Recommendations 2019
Over the 1980’s through to the early 2000’s there was a wealth of salinity management resources produced on; soil and water testing, perennial pastures, saltbush, and more.
Links to many of these resources that are relevant to this region have been compiled at;
Recent findings from the Saltland Pasture Redemption Project can be accessed at on the Saltland Pasture Redemption Project web page.
A focus of this project has included exploring how the salt tolerant legume Neptune Messina grows in local conditions.
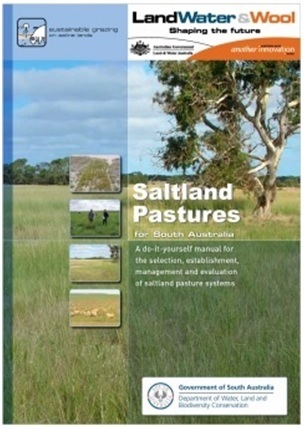
An excellent resource that is still extremely relevant is the ‘Saltland Pastures for South Australia Manual’. This document can be found at the following link here.
12. Current Projects
Information on the Saltland Pasture Redemption Projects can be accessed here.
A focus of this project has included exploring how the salt tolerant legume Neptune Messina grows in local Coorong District conditions, and use of mulching to reduce evapo-concentration of salts at the soil surface.
A series of Mallee Seeps Projects have and are being delivered in the Mallee to better understand this landscape phenomena. More information and access to Mallee Seeps resources can be found at https://msfp.org.au/mallee-seeps/
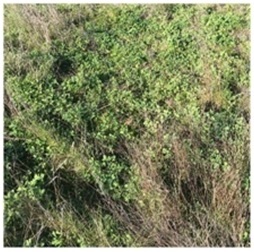
Above: Second year Puccinellia & Messina pasture on moderately saline ground at Meningie East
13. Please click here to access the Coorong Dryland Salinity Literature Review
Funding Acknowledgements
These activities have received grant funding from the Australian Government Department of Agriculture and Water Resources, including;
National Landcare Program, Smart Farms Program & Regional Land Partnerships – an Australian Government initiative


This project is supported by the South Australian Murray-Darling Basin
Natural Resources Management Board through funding from the
Australian Government’s National Landcare Program and the NRM levies
